Spatial blueprinting and the zero-redundancy project command center
How I eliminated double data entry across manufacturing project management, unifying spatial build breakdown, dual-engine milestone tracking, live dock procurement sentinels and financial material flow into a single connected command center.
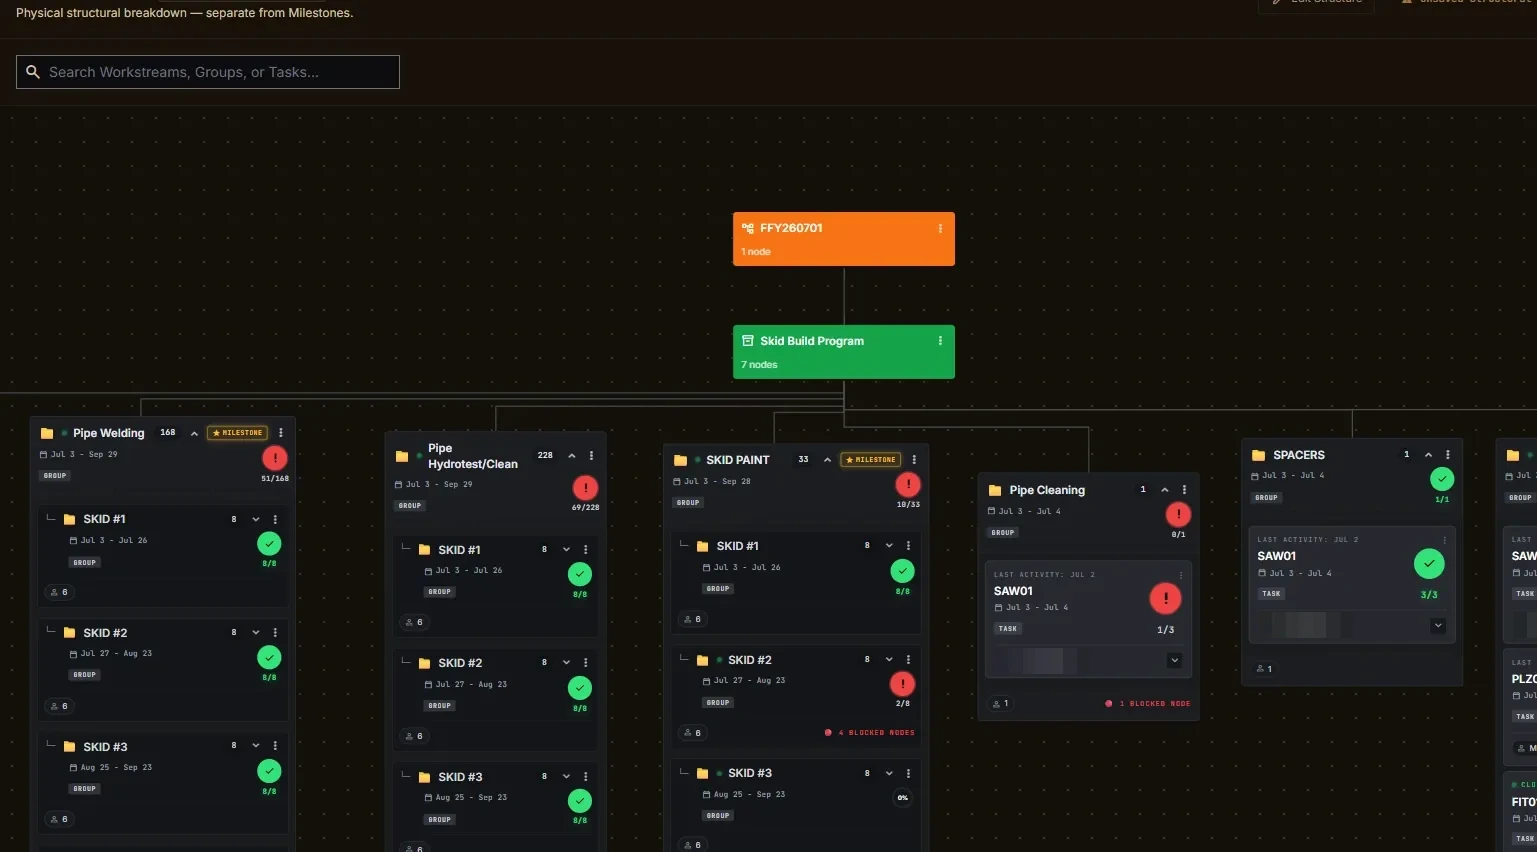
The production Deliverables Map. The orange root carries the project, the green node is the build program, slate headers are assembly groups holding rollup fractions such as 51 of 168, and graphite cards are the executable operations. The header states the boundary out loud: physical structural breakdown, separate from milestones.
The $50,000 cost of running a hangar on a shared drive
Custom aerospace manufacturing means orchestrating multi-ton piping skids, high-pressure vessels and thousands of raw fittings under strict delivery windows. A representative scope reads: an 8 inch Schedule 40 piping skid build, four sub-assemblies in 304L and 316L, with all piping hydrostatically tested and certified to client aerospace standards before final assembly sign-off.
Yet across partner fabrication facilities, the entire operation ran off fragmented spreadsheets on a shared drive. That baseline created constant operational vulnerability.
The single-user bottleneck
Only the shop owner updated the master schedule with any regularity. Everyone else avoided the shared file, so coordinators worked against data that was already days stale.
A $50,000 revision mistake
With no access control and no clear version history, an old bill of materials was worked from as though it were current. The error was found on the floor, in steel.
Double data entry fatigue
Project managers re-typed the same assembly hierarchy three times: once for quoting, once for scheduling, and again for purchasing.
When Vinay Konuru, VP of Product and Technology, opened the request, he did not send a specification. He sent a photograph of the shop monitor.
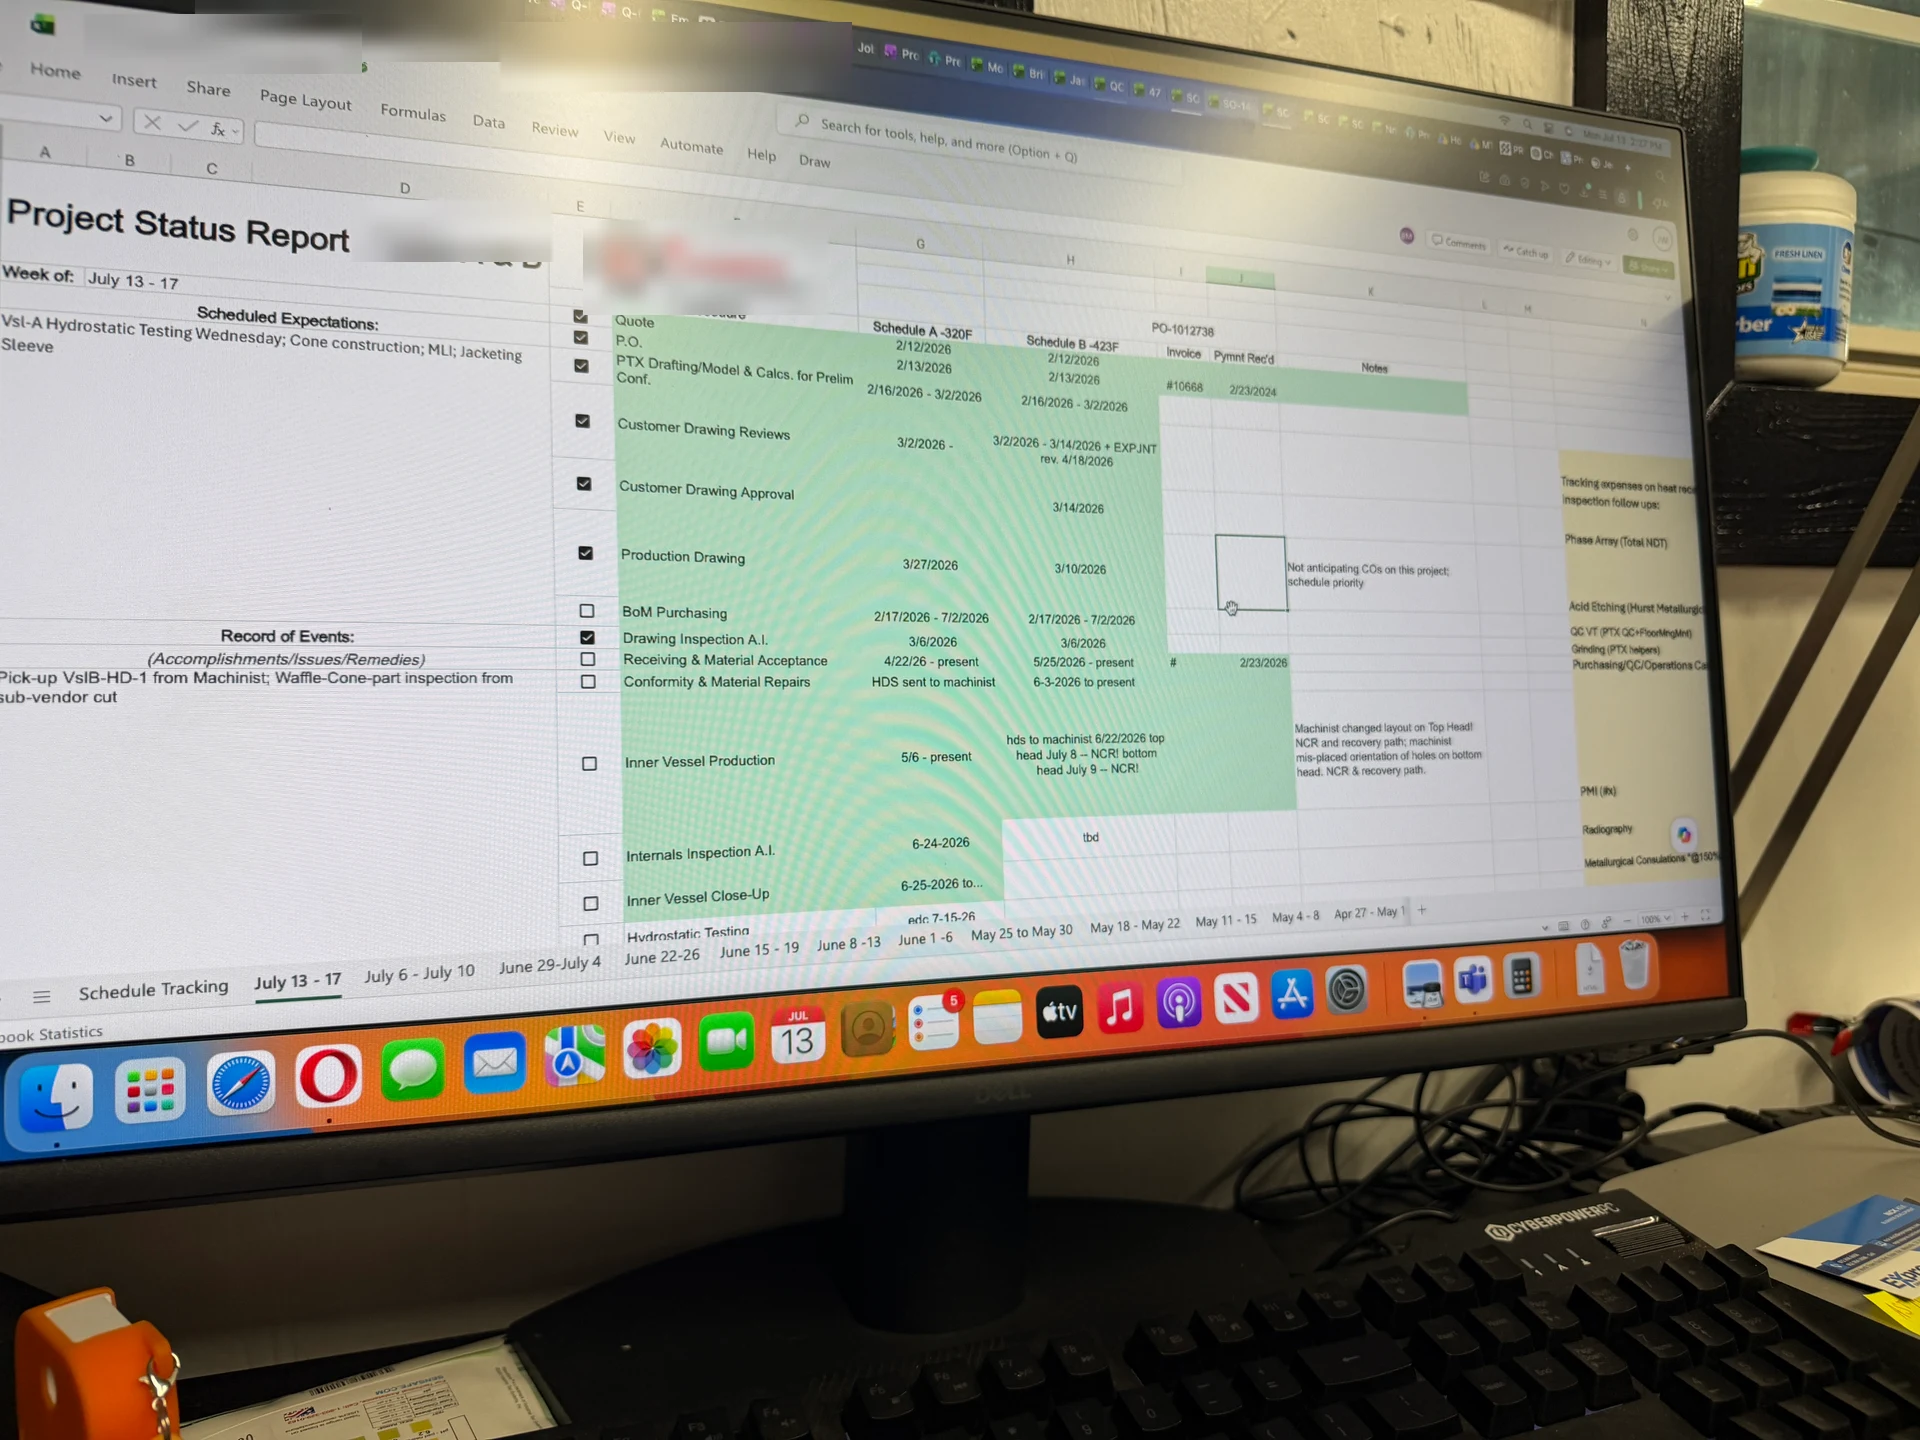
The baseline: a project status workbook on a shop monitor. Ten disconnected tabs, hand-coloured cells and a manually maintained timeline, with the facility identifiers masked. This photograph was the feature request.
“We’ve discussed in the past the need for tracking milestone progress markers on projects. I’d like you to build a milestone builder and tracker for quotes and projects. This will give users a quick check on where we’re at on the project, and allow us to get a total export on the project. Milestones can be connected up to line items in tasking.”
I want to lay out the skid structure the same way it exists physically on the floor. I don't want to rebuild the work breakdown all over again in another tab just to assign people.
Trevor Goldston
Shop Operations Lead
To a client, I wouldn't say we are on weld number 4 of this pipe spool. I would say we are 70% done with piping on Skid 1. Milestones are client-facing summaries; tasking is internal shop execution.
Vinay Konuru
VP Technology & Product
Our entire facility was running off a single shared spreadsheet. A $50,000 fabrication mistake happened simply because teams looked at mismatched BOM revisions across un-synced files.
Partner facility shop lead
Partner facility reality
Deploying all work streams at once is dangerous because it disrupts active welder sessions. We need selective, per-work-stream deployment so a manager can update Skid 2 without touching active floor terminals.
Sai Tangudu
Full-stack engineering
My first exploration tried to answer all of that on one screen. If the data existed, it got a panel: task counts, burn-down curves, activity feeds, progress rings. It reviewed well as a picture, and Vinay’s note above is what ended it.
That is not a critique of a layout, it is a scope boundary, and once it was named the architecture fell out of it. The Deliverables Map owns structure: what is being built and how it decomposes physically, which is the client-facing model. Tasking owns execution: who is doing the work, on which shift, against which weld, which a client should never see.
The failed exploration was trying to show both at once, which is why it read as decoration. A chart is not insight if nobody on the floor is producing the number it plots.
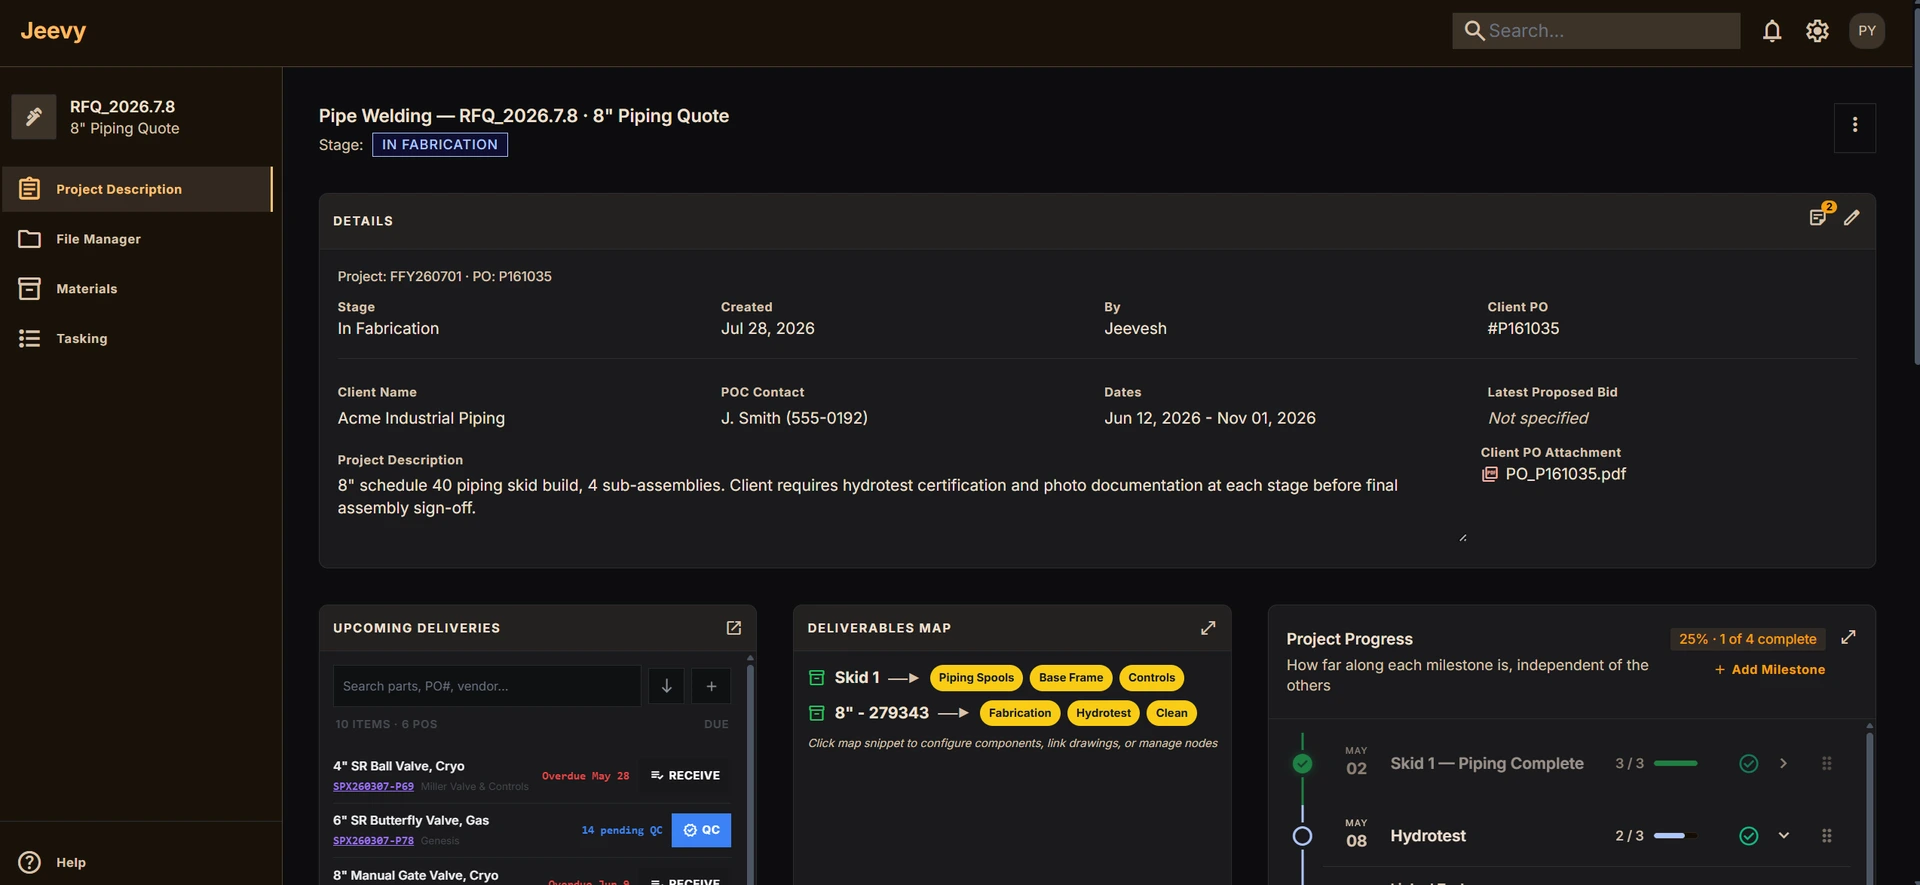
The exploration that got the pushback: four panels competing for one screen, several of them charting data the shop did not actually produce.
Spatial blueprinting on an infinite canvas
Manufacturing coordinators do not think in flat table rows. They think in skid frames, pipe manifolds and sub-assemblies, arranged in space. So I built the Deliverables Map as an infinite canvas with a strict four-tier hierarchy, where depth in the tree means depth in the physical build.
Top-level program identification across a multi-skid aerospace package. One per project, and the only node that cannot be re-parented.
A major physical build program, carrying a live count of the leaf nodes beneath it so a coordinator can judge its weight without expanding it.
An assembly folder holding timeline constraints, a rollup fraction computed from its children, and any exception flags raised underneath it.
The executable unit: a split-grid card with assignee, date window, a completion fraction, and a presence dot showing recent floor activity.
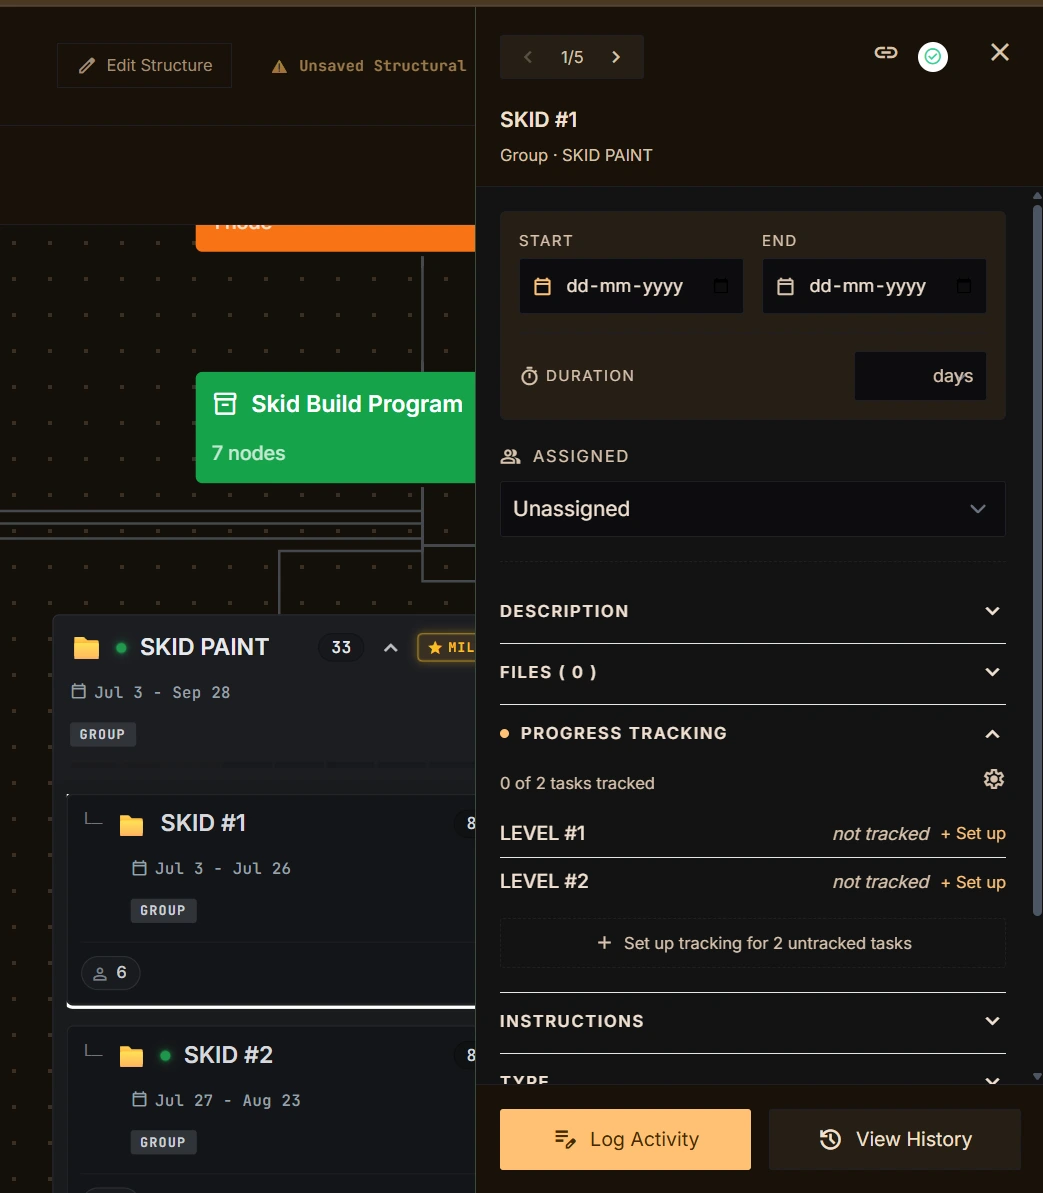
Node detail at working scale. Each group carries its date window, its rollup fraction, and the exceptions raised underneath it, so the shape of the tree already tells you where the trouble is.
The structure cascades downstream. The spatial breakdown is the single source of truth for build structure, so laying out a workstream and nesting operations under it generates the executable task rows automatically. Nobody re-types a hierarchy that already exists.
This is where the double data entry went. It was never a discipline problem. The same structure genuinely was needed in three places, and until one of them owned it, all three had to be maintained by hand.

“Forcing users to choose between a task or a group upfront creates friction. Treat everything like a clean to-do item. The moment an engineer nests a sub-operation underneath it, it should automatically convert into a group envelope.”
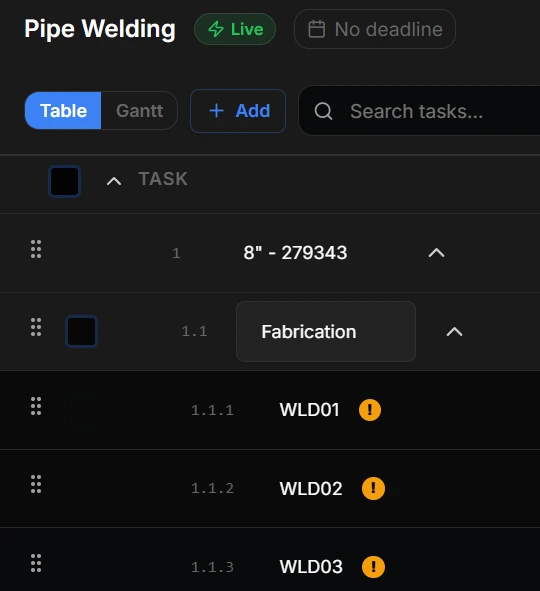
The tasking view, generated from the map rather than entered into. The hierarchy arrives already built, and the shop adds only what is theirs: assignment, timing and progress.
Automated signals and contract gates
A manufacturing schedule carries two different kinds of milestone, and conflating them is what makes most project tools untrustworthy. One kind is objective physical progress. The other is a formal commercial gate. They are measured differently, so they are built differently.
Auto-linked milestones. A coordinator promotes any node on the map to a milestone with its star control. Its fraction and completion bar are then computed from the work signals underneath it, so the number moves when the floor moves and nobody maintains it.
Manual checkpoints. Commercial sign-offs such as hydrotest certification or invoice approval are created by hand and carry no percentage at all. A contract gate is either met or it is not, and inventing a completion figure for one would be worse than showing nothing.
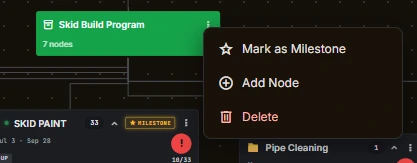
An auto-linked milestone: promoted from a map node, with its fraction computed from the work beneath it.
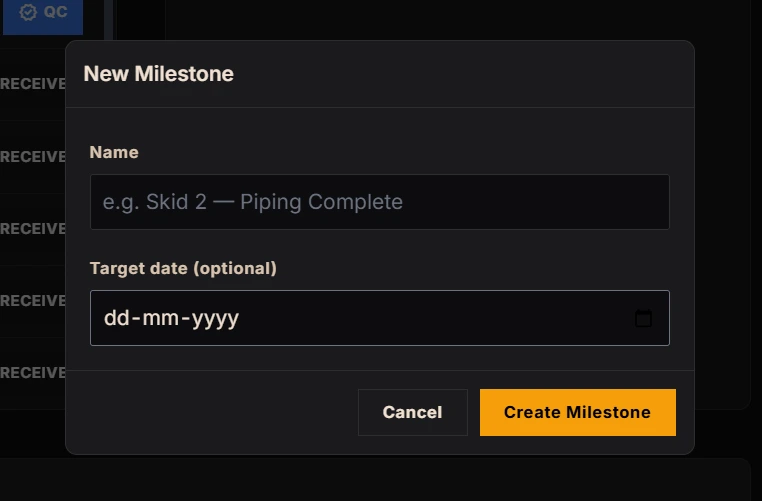
The manual checkpoint dialog. A name and an optional target date, and deliberately no completion percentage: a contract gate is met or it is not.
Tracing bottlenecks through a financial flow diagram
When a purchase order slips, a project manager needs one answer: which assembly steps are now starved of hardware. That is a flow question, not a table question, so I proposed a Sankey diagram in an ideation thread.
Loving this idea for the material breakdown. It's a Sankey diagram. We could structure the data flow from left to right to track procurement. Imagine from the left: total BOM materials, then on order, received and sign-off, then material type allocation as a percentage, pipes and spools at 25%, electrical and wiring at 15% and so on, for the received ones. I think this helps PMs get an easy glance at whether BOM materials are stuck in on order, and gives an instant idea of which parts are assigned to which tasks.
Oh yeah, that'd be great for materials! Love Sankey diagrams.
I last saw them on the Loki series. Oh, those are timeline branches, my bad.
The flow runs in four tiers, left to right: the total project bill of materials, its supply status, the engineering category it belongs to, and the tasks that consume it. Read across, it answers where the money is sitting and what that money is holding up.
Bottleneck tracing. When a delivery is late, the affected ribbons turn crimson and carry an exception marker, so the eye follows the problem from the stalled order to the operation it is blocking without anyone running a query.
Quantities or dollars. The same flow can be scaled by item count or by financial exposure. Toggling to dollars re-weights every ribbon, which turns the diagram into a cash-flow review and makes it obvious when a single high-value capital component deserves expediting ahead of a larger pile of consumables.
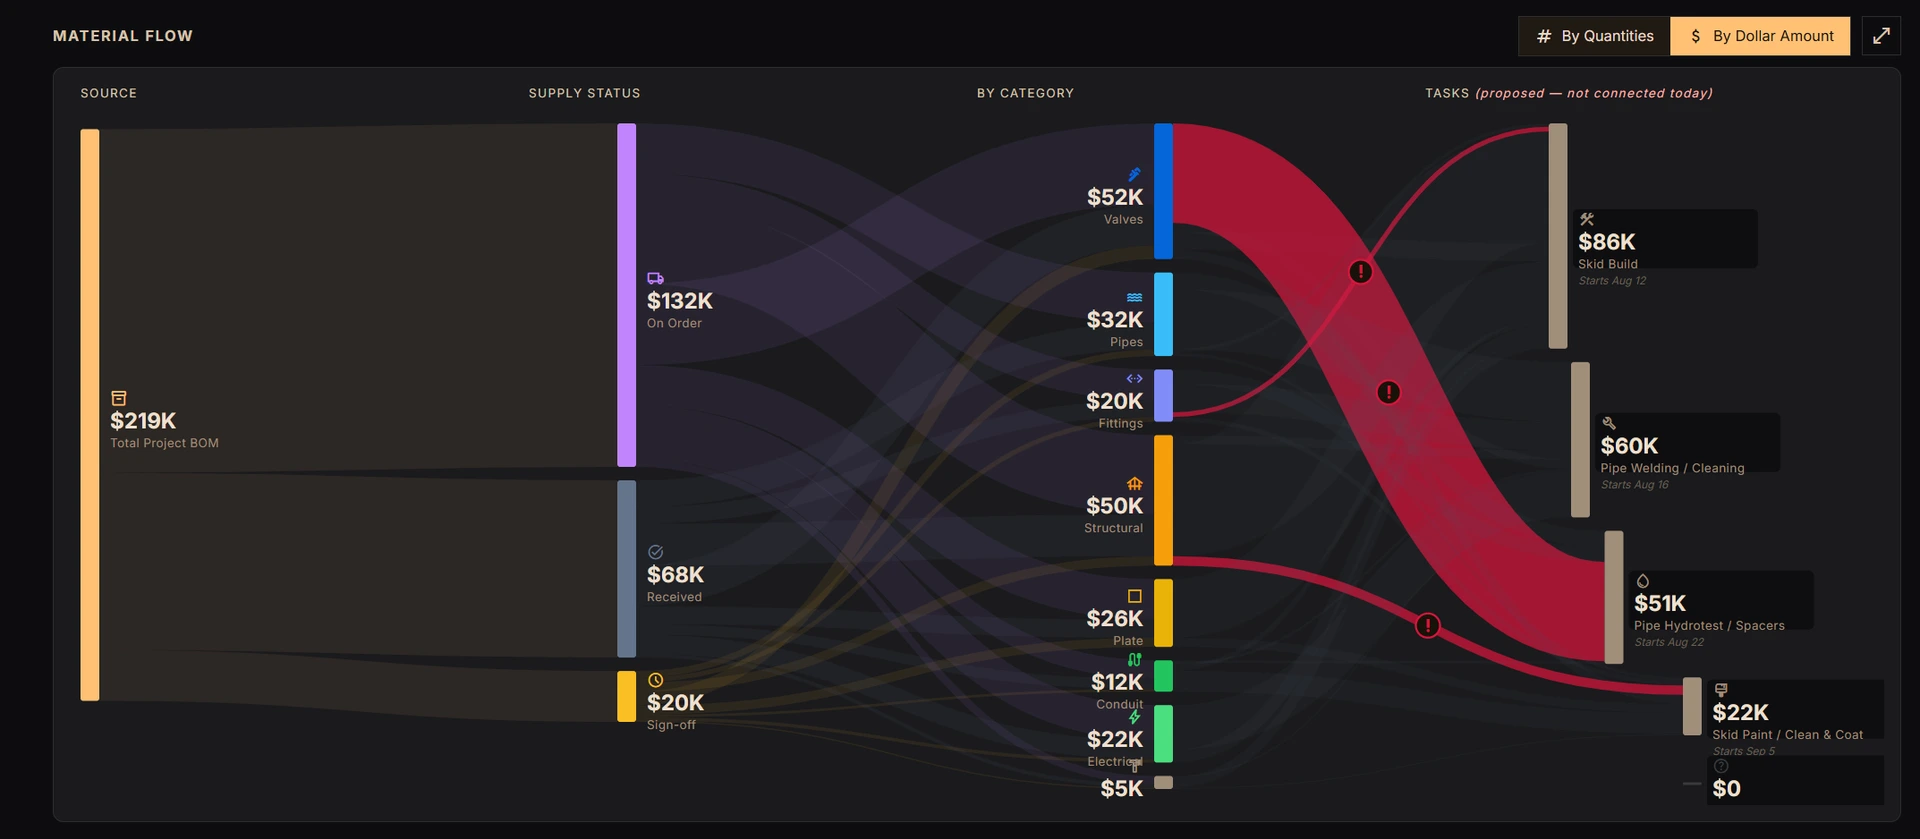
Material flow in dollar mode: $219K of bill of materials resolving through $132K on order, $68K received and $20K signed off, into categories and then into the operations that consume them. The crimson ribbons carry the delays. The tasks tier is labelled in-product as proposed and not yet connected, which is the honest state of it today.
Draft and deploy, borrowed from version control
Restructuring a live project pushes changes to terminals that crews are actively working from. A re-parented assembly is an improvement to a planner and an interruption to a welder, which is the risk Sai named in the discovery notes above.
An isolated draft workspace. Re-parenting sub-assemblies and creating new groups happens inside a draft version of the blueprint. The floor keeps running on the deployed one, so structural thinking costs the shop nothing until somebody decides it is ready.
Selective deployment. Changes ship per workstream through a deploy control with checkboxes, rather than as a single all-or-nothing overwrite. A coordinator can release the part they are confident about and keep working on the rest.
Validation before release. Deploying runs a sweep for circular dependencies and orphaned constraints first. The check exists because the failure it prevents is silent: a structure that looks correct on the canvas and deadlocks on the floor.
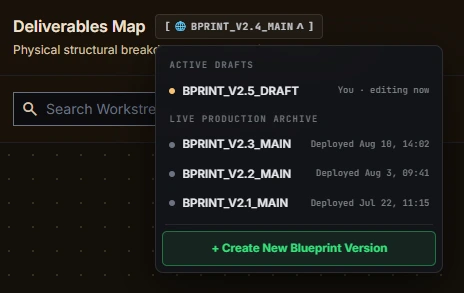
The blueprint version control: the active draft, per-workstream deploy selection, and the validation sweep that runs before anything reaches a floor terminal.
Verified Outcomes
- Zero double data entry. Auto-propagating structural nodes into the tasking module eliminated manual work-breakdown re-typing entirely.
- Instant bottleneck visibility. Tracing material dependencies through the flow diagram reduced delay identification from days to seconds.
- Dual-engine progress parity. Shop-floor completion signals and high-level contract milestones stay synchronised, removing status reporting discrepancies.
- Safe structural governance. Draft and deploy sandboxing prevented accidental floor disruption during active shift operations.
One structural core, not more tabs
The refactor proved that a complex manufacturing operation does not need more separate feature tabs. It needs one structural core that everything else reads from.
Treating the physical skid build as the primary model is what made the rest resolve. Task dispatch, milestone reporting and procurement tracking stopped being three systems that had to be kept in agreement and became three views of the same object.
The August 5 pushback is the part I would keep. A screen full of charts looked like progress and was actually the opposite, and it took someone who works the floor to say so. The same instinct runs through the tasking and critical path engine ↗, where the constraint was physical steel rather than scope.